Applications
 Acoustic scene classification
The goal of acoustic scene classification is to classify a test recording into one of the provided predefined classes that characterizes the environment in which it was recorded — for example “park”, “home”, “office”.

System overview for acoustic scene classification application.
More information on DCASE2017 Task 1 page.
Results
TUT Acoustic Scenes 2017, Development
Average accuracy of file-wise classification.
| Overall | Folds | ||||
|---|---|---|---|---|---|
| System | Accuracy | 1 | 2 | 3 | 4 |
| MLP based system, DCASE2017 baseline | 74.8 % | 75.2% | 75.3 % | 77.3 % | 71.3 % |
| GMM based system | 74.1 % | 74.0 % | 76.0 % | 73.1 % | 73.2 % |
Scene class-wise results
| System | ||
|---|---|---|
| Scene class | MLP | GMM |
| beach | 75.3 | 75.0 |
| bus | 71.8 | 84.3 |
| cafe/restaurant | 57.7 | 81.7 |
| car | 97.1 | 91.0 |
| city center | 90.7 | 91.0 |
| forest path | 79.5 | 73.4 |
| grocery store | 58.7 | 67.9 |
| home | 68.6 | 71.4 |
| library | 57.1 | 63.5 |
| metro station | 91.7 | 81.4 |
| office | 99.7 | 97.1 |
| park | 70.2 | 39.1 |
| residential area | 64.1 | 74.7 |
| train | 58.0 | 41.0 |
| tram | 81.7 | 79.2 |
| Overall | 74.8 | 74.1 |
To reproduce the results run:
make -C docker/ task1
See more about reproducibility.
Results calculated with Python 2.7.13, Keras 2.0.2, and Theano 0.9.0
TUT Acoustic Scenes 2017, Evaluation
Average accuracy of file-wise classification.
| Overall | |
|---|---|
| System | Accuracy |
| MLP based system, DCASE2017 baseline | 61.0 % |
Scene class-wise results
| Scene class | MLP |
|---|---|
| beach | 40.7 |
| bus | 38.9 |
| cafe/restaurant | 43.5 |
| car | 64.8 |
| city center | 79.6 |
| forest path | 85.2 |
| grocery store | 49.1 |
| home | 79.9 |
| library | 30.6 |
| metro station | 93.5 |
| office | 73.1 |
| park | 32.4 |
| residential area | 77.8 |
| train | 72.2 |
| tram | 57.4 |
| Overall | 61.0 |
 Detection of rare sound events
This task focuses on detection of rare sound events in artificially created mixtures. The goal is to output for each test file the information on whether the target sound event has been detected, including the textual label, onset and offset of the detected sound event.

System overview for detection of rare sound events application.
More information on DCASE2017 Task 2.
Results
TUT Rare Sound Events 2017, Development
Event-based metric
| Event-based metrics | ||
|---|---|---|
| System | ER | F-score |
| MLP based system, DCASE2017 baseline | 0.53 | 72.7 % |
| GMM based system | 0.55 | 72.5 % |
Event class-wise results
| System | ||||
|---|---|---|---|---|
| MLP | GMM | |||
| Event class | ER | F-score | ER | F-score |
| babycry | 0.67 | 72.0 | 0.77 | 67.6 |
| glassbreak | 0.22 | 88.5 | 0.35 | 82.8 |
| gunshot | 0.69 | 57.4 | 0.54 | 67.2 |
| Overall | 0.53 | 72.7 | 0.55 | 72.5 |
To reproduce these results run:
make -C docker/ task2
See more about reproducibility.
Results calculated with Python 2.7.13, Keras 2.0.2, and Theano 0.9.0
More details on the metrics calculation can be found in:
Annamaria Mesaros, Toni Heittola, and Tuomas Virtanen, “Metrics for polyphonic sound event detection”, Applied Sciences, 6(6):162, 2016 [HTML][PDF]
TUT Rare Sound Events 2017, Evaluation
Event-based metric
| Event-based metrics | ||
|---|---|---|
| System | ER | F-score |
| MLP based system, DCASE2017 baseline | 0.63 | 64.1 % |
Event class-wise results
| MLP | ||
|---|---|---|
| Event class | ER | F-score |
| babycry | 0.80 | 66.8 |
| glassbreak | 0.38 | 79.1 |
| gunshot | 0.73 | 46.5 |
| Overall | 0.63 | 64.1 |
 Sound event detection in real life audio
This task evaluates performance of the sound event detection systems in multisource conditions similar to our everyday life, where the sound sources are rarely heard in isolation. In this task, there is no control over the number of overlapping sound events at each time, not in the training nor in the testing audio data.
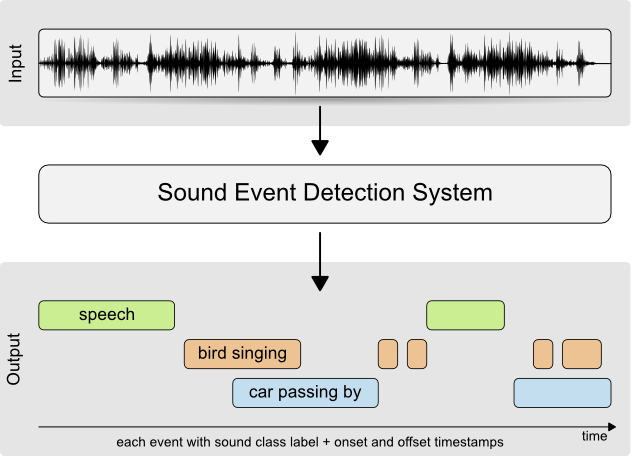
System overview for sound event detection in real life audio application.
More information on DCASE2017 Task 3.
Results
TUT Sound Events 2017, Development
Segment-based metric
| Segment-based metrics | ||
|---|---|---|
| System | ER | F-score |
| MLP based system, DCASE2017 baseline | 0.69 | 56.7 % |
| GMM based system | 0.71 | 52.1 % |
Event class-wise metrics
| System | ||||
|---|---|---|---|---|
| MLP | GMM | |||
| Event class | ER | F-score | ER | F-score |
| brakes squeaking | 0.98 | 4.1 | 1.06 | 13.6 |
| car | 0.57 | 74.1 | 0.60 | 66.4 |
| children | 1.35 | 0.0 | 1.54 | 0.0 |
| large vehicle | 0.90 | 50.8 | 0.98 | 38.0 |
| people speaking | 1.25 | 18.5 | 1.23 | 28.5 |
| people walking | 0.84 | 55.6 | 0.61 | 65.6 |
To reproduce these results run:
make -C docker/ task3
See more about reproducibility.
Results calculated with Python 2.7.13, Keras 2.0.2, and Theano 0.9.0
More details on the metrics calculation can be found in:
Annamaria Mesaros, Toni Heittola, and Tuomas Virtanen, “Metrics for polyphonic sound event detection”, Applied Sciences, 6(6):162, 2016 [HTML][PDF]
TUT Sound Events 2017, Evaluation
Segment-based metric
| Segment-based metrics | ||
|---|---|---|
| System | ER | F-score |
| MLP based system, DCASE2017 baseline | 0.94 | 42.8 % |
Event class-wise metrics
| MLP | ||
|---|---|---|
| Event class | ER | F-score |
| brakes squeaking | 0.92 | 16.5 |
| car | 0.77 | 61.5 |
| children | 2.67 | 0.0 |
| large vehicle | 1.44 | 42.7 |
| people speaking | 1.30 | 8.6 |
| people walking | 1.44 | 33.5 |